PHOENIX ENERGY

Pioneering Innovative and Sustainable Energy Solutions.

Yusuf Furkan ERGÜR

Founder, Phoenix Energy

ABOUT PHOENIX

An Investment by Sabancı® Arf

PHOENIX ENERGY

Industrial Waste Heat to Hydrogen

A patent-protected integration model for CBAM-era heavy industry. Phoenix Enerji — the IP architecture of industrial transformation.

MARKET REALITY

The Technology Exists — The Architecture Creates Value

The Real Question

Thermoelectric generators (TEGs) and electrolyzers are commercially available worldwide today. The question is no longer “does the technology exist?” — it’s how you integrate these technologies with a flue stack and electrolyzer to generate economic results.

Phoenix does not sell hardware. Phoenix licenses the IP and integration architecture that makes the economic outcome possible.

Global Hardware Suppliers

1975 to present · 40,000+
systems · 55+ countries · 5W–
500W modular TEG

Nel & Siemens Energy

Nel: 1.5 GW capacity (2024) ·
Siemens: 3 GW/yr target
(2025) · 500 MW PEM + 1 GW
alkaline

Plug Power & thyssenkrupp nucera

Plug Power: 317 MW+ shipped · tkn: 700 MW+ single project · proven supply chain

CRITICAL GAP

Why Hardware Alone Is Not Enough

A TEG supplier gives you the generator. An electrolyzer supplier gives you the H2 production equipment. But neither typically provides what actually drives profitability.

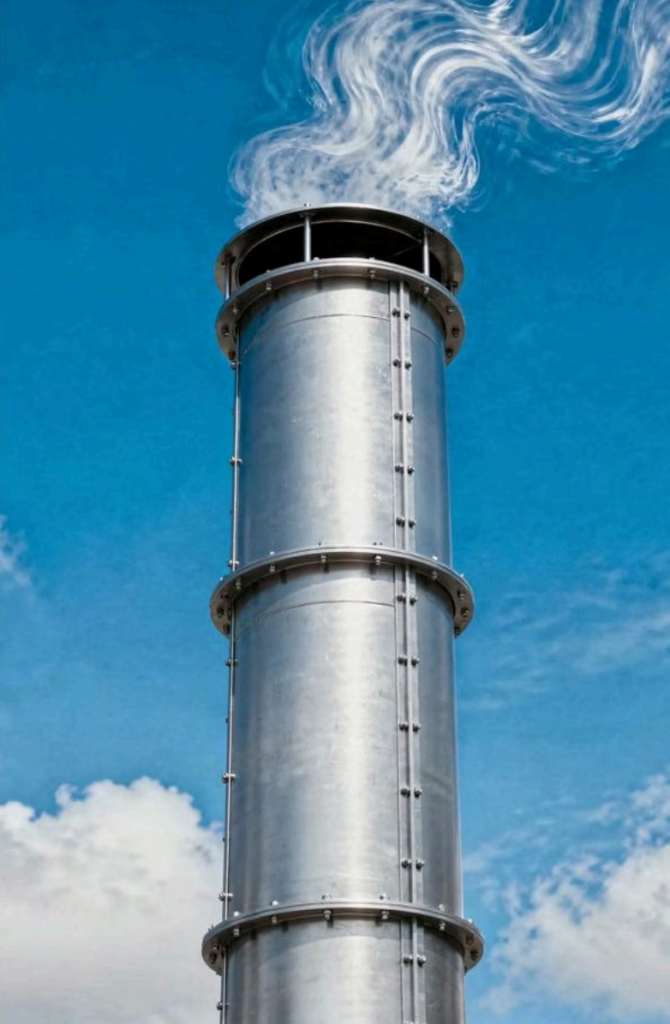
Heat Transfer Architecture

Optimal thermal contact design on the flue surface and module placement engineering — the critical area left out of supplier scope.

Process Feedback Loop

Efficiently feeding TEG-generated
electricity back into the process and converting electrolyzer waste heat into secondary benefit.

Profit Architecture

Designing the entire system as a single economic loop. Hardware exists in the market — but “profit architecture” does not. This gap is where Phoenix creates its value.

IP PORTFOLIO

Phoenix Protects Architecture, Not Hardware

Two patents together protect the full TEG + flue + electrolyzer + waste heat + feedback topology.

Patent 1 — TR 2024/005002

“A System for Waste Heat Recovery from Industrial Flues”

PCT counterpart: PCT/TR2025/050158

Novelty and industrial applicability criteria met in Turkey; file continues in second examination phase.

Patent 2 — TR 2025/015708

“Electrolyzer System Integrated with Thermoelectric Energy Recovery Module”

PCT counterpart: PCT/TR2026/050266

Research request filed in Turkey; PCT search report pending.

CBAM ANALYSIS

Why CBAM Is Critical — The Numbers Speak

CBAM’s full implementation period began on 1 January 2026. In the first 2026 data, approximately 98% of CBAM-covered volume came from iron and steel. Scope today covers cement, iron-steel, aluminum, fertilizers, electricity, and hydrogen.

CBAM COST TABLE

Turkish Industry: Rising Carbon Costs by Sector

Based on EBRD Turkey sector roadmaps. CBAM cost = emission intensity × EUA price × phase-in rate.

Sector / Route Emission Intensity 2026 CBAM 2030 CBAM 2034 Full Load
EAF Steel (Turkey avg.) 0.29 tCO₂/t €0.56/t €10.80/t €22.27/t
Integrated Steel (Turkey avg.) 2.20 tCO₂/t €4.22/t €81.93/t €168.94/t
Cement (Turkey avg.) 0.82 tCO₂/t €1.57/t €30.54/t €62.97/t
Aluminum (BAU scenario) 5.34 tCO₂/t €10.25/t €198.88/t €410.06/t

PUBLIC REFERENCES

Turkey's Best Players Are Still Under Pressure

Public company data alongside Turkey averages confirms the reality of CBAM pressure. Even the best-performing facilities cannot escape carbon costs — they can only manage them better.

Çolakoğlu Metalurji

2023 Scope 1+2: 0.34 tCO₂/ton steel
Full CBAM exposure: ~€26.11/t steel

OYAK Çimento

2023 emission level: 621 kg CO₂/t cement
Full CBAM exposure: ~€47.69/t cement

Assan Alüminyum

2024 intensity: 0.689 tCO₂/ton
Full CBAM exposure: ~€52.91/t product

ECONOMIC IMPACT

Every Recovered MW Works Directly on H₂ Cost

Electricity is the primary cost driver in electrolysis. Every continuous MW recovered via TEG-flue integration directly reduces H₂ production cost. At 50 kWh/kg consumption, 1 MW continuous = 175.2 tons H₂/yr; at 40 kWh/kg, 219.0 tons H₂/yr.

5 MW

Continuous Recovery

876–1,095 ton H₂/yr equivalent electricity advantage

10 MW

Continuous Recovery

1,752–2,190 ton H₂/yr equivalent electricity advantage

BUSINESS MODEL

Phoenix Licenses Profitability, Not Equipment

What Phoenix Does NOT Do

  • Sell TEGs
  • Sell electrolyzers
  • Act as EPC contractor

What Phoenix DOES Do

  • IP Licensing — integration architecture rights
  • Integration Design — flue + TEG + electrolyzer system
  • Process Consulting — economic loop optimization
  • Revenue Sharing — optional performance-based model

Phoenix does not inflate CAPEX — it generates higher cash flow from the same CAPEX. We license economics, not hardware risk.

CLOSING

You Can Buy the Hardware. Only the IP Unlocksthe Economics.

Buy Hardware Anywhere

TEGs and electrolyzers can be sourced from anywhere in the world — the supply chain is ready and proven.

Only IP Opensthe Economics

The architecture protected under TR 2024/005002 and TR 2025/015708 transforms a working system into a competitive system.

Phoenix Licenses Profitability

An IP company that earns not from CAPEX — but from the profitability it unlocks in the CBAM era.